Power BI Analytics: Credit Risk Management Dashboard System
Comprehensive credit risk analytics framework enabling financial institutions to monitor portfolio health, detect early default signals, and optimize lending strategies across 140,000 loan records spanning 2007-2014 financial crisis period.
FinTech Lending Platform
U.S. Market
2007
Financial Services
Credit Risk Management
140,000+ loan records
2007-2014 period
50+ U.S. states
7-year credit cycle
including 2008 financial crisis
and recovery phase
Challenge
Financial institutions managing lending portfolios during 2007-2014 lacked integrated analytical capabilities to monitor portfolio health deterioration. The 2011-2012 period exhibited "False Recovery Peak" where 107-108% recovery rates masked quality decay, with good loans declining from 76% to 24% while bad loans surged from 16% to 38%.
Critical gaps included inability to detect early default signals across 140,000+ loan records, absence of geographic risk visibility revealing South region's $646M allocation (45% portfolio) with lowest recovery at 75.7%, and lack of frameworks decomposing credit metrics (PD, LGD, Expected Loss, ROI).
The 73.79% portfolio concentration in loans aged 40-60% through term created systematic vulnerability to mid-tenure defaults. Without real-time visibility into vintage deterioration effects and regional economic exposure, institutions required comprehensive dashboards enabling proactive risk mitigation and strategic rebalancing decisions.
Results
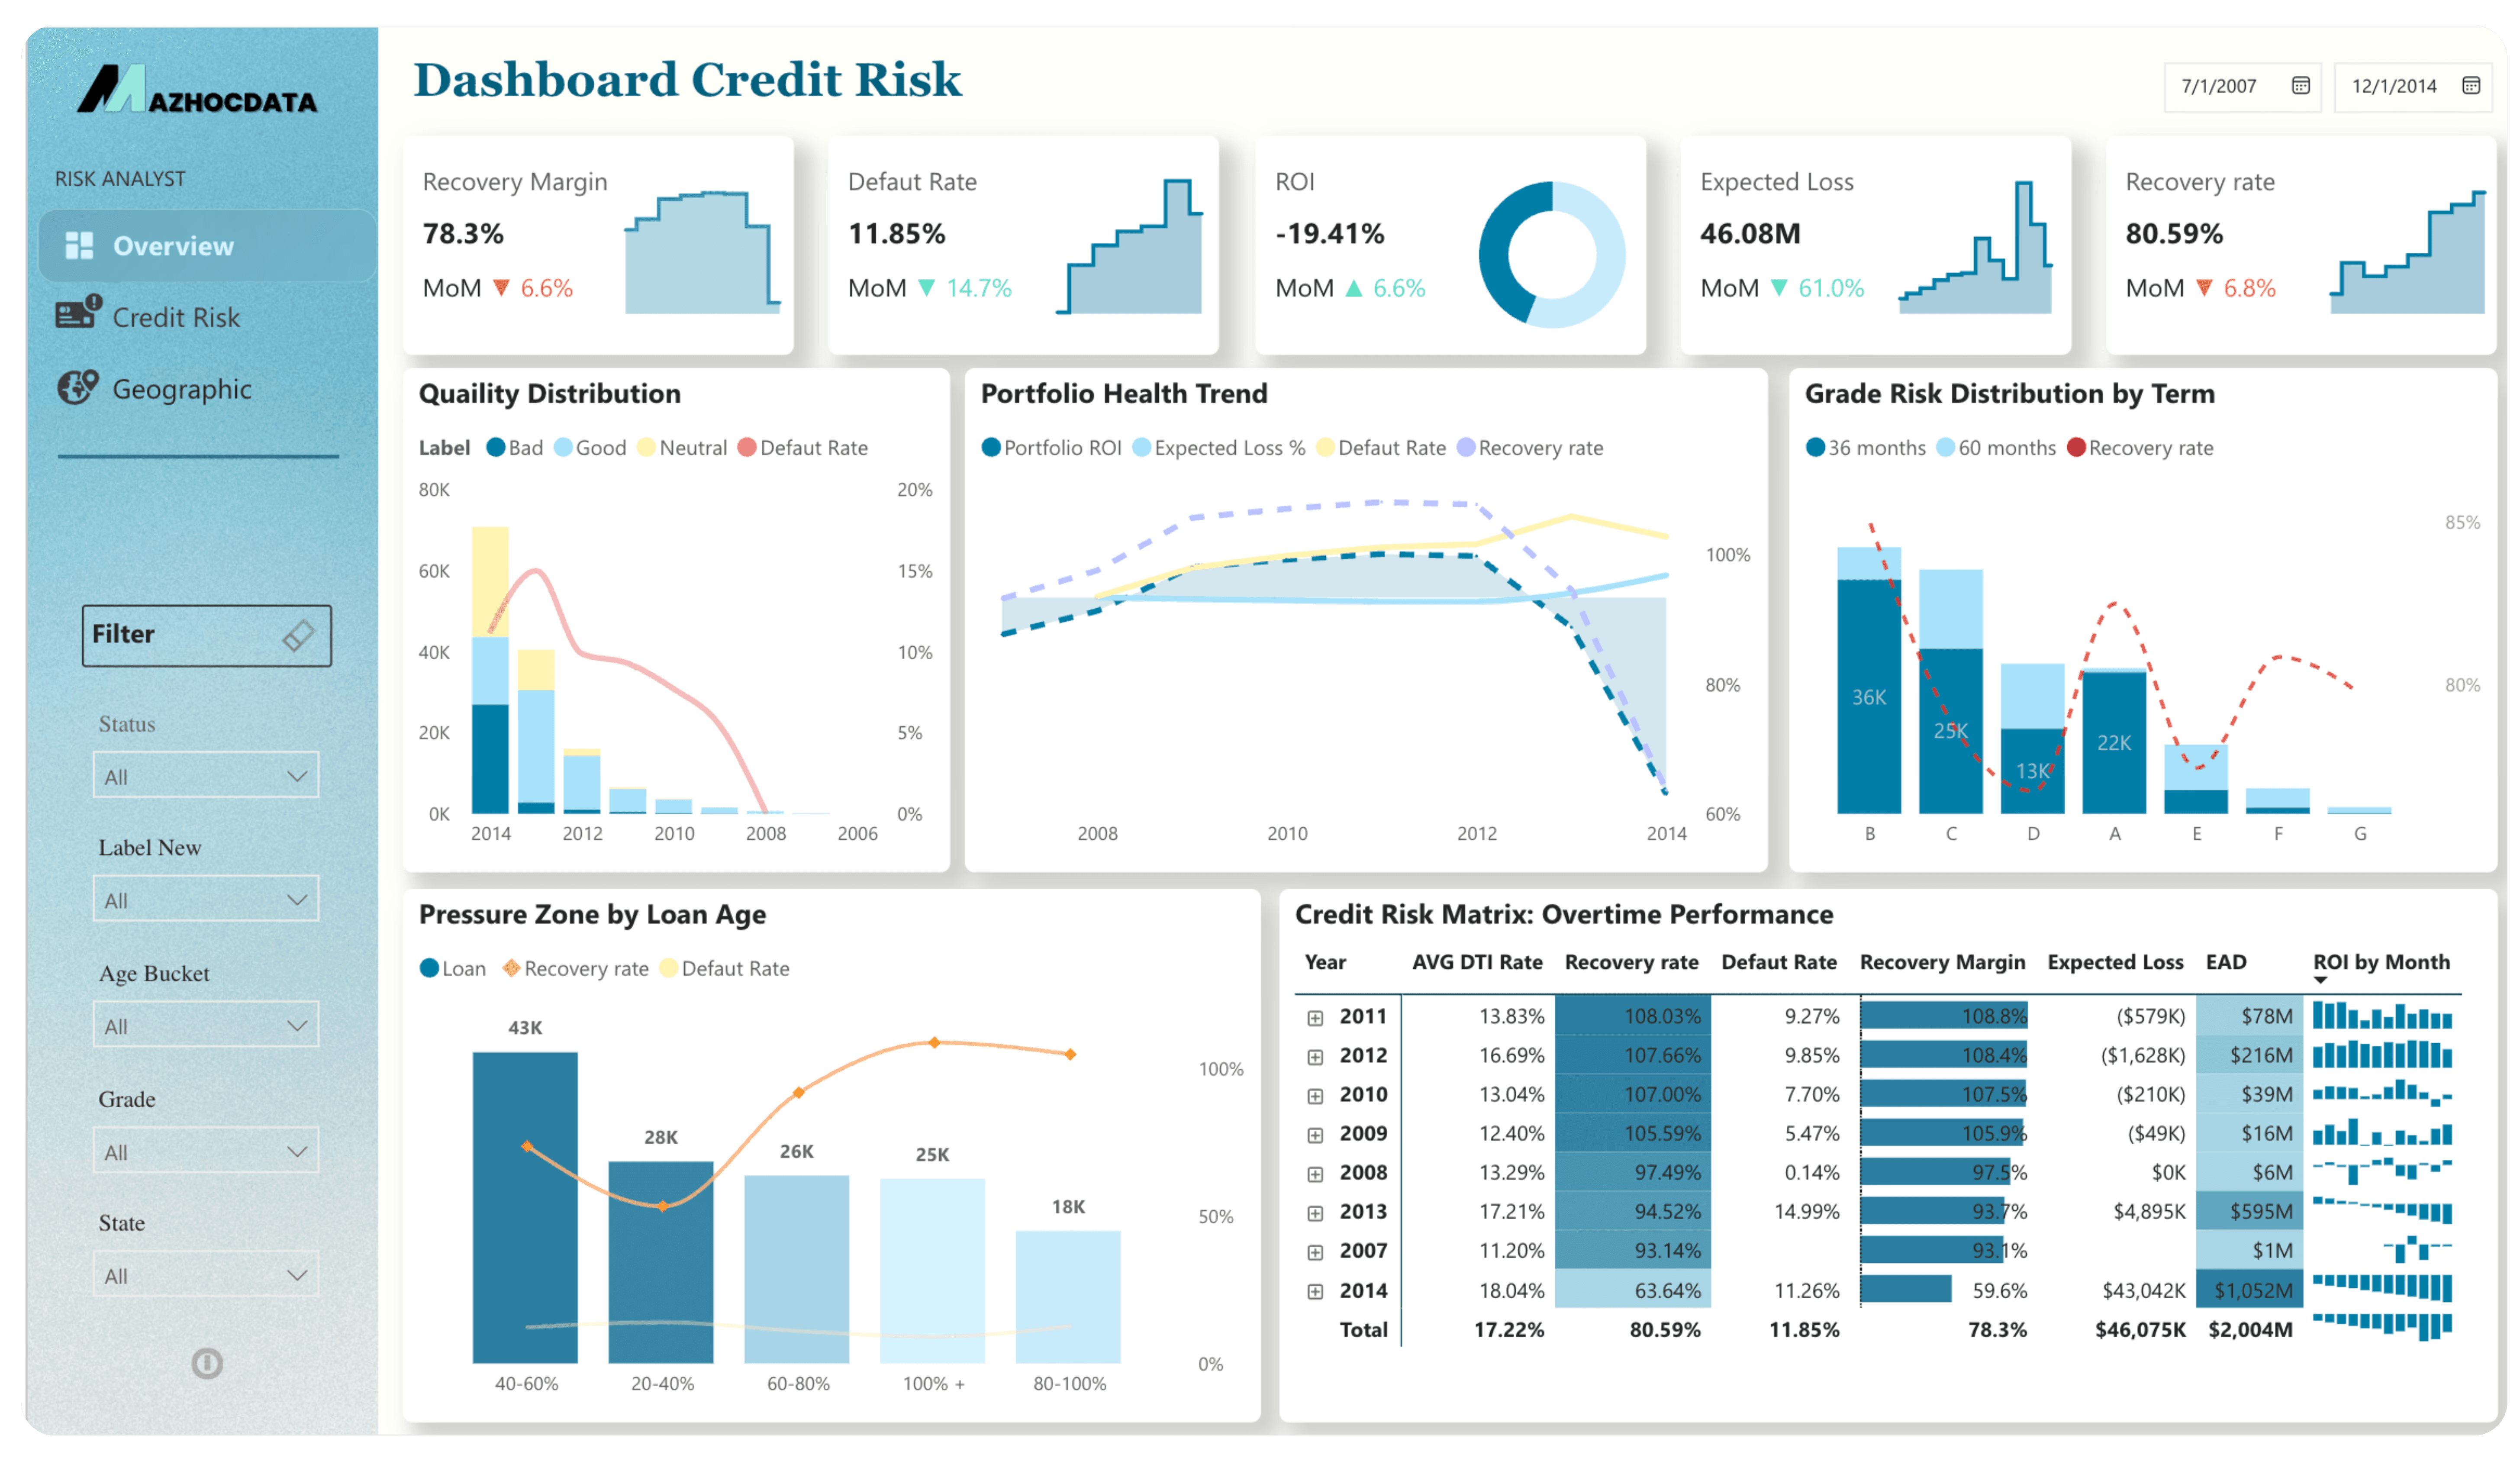
Portfolio monitoring revealed three-phase credit cycle: conservative lending (2008-2010), standards relaxation (2011-2012), and structured defaults (2013-2014). "Good" loans with ROI +50% (2011) converted to negative ROI by 2014.
Geographic analysis identified South region mismatch—$646M allocation with 75.7% recovery versus East's 81.3% on $533M—representing $50-100M annual income destruction. Recovery collapsed from 86-92% to 75.7%.
Quality distribution: Good (49.18%), Bad (22.68%), Neutral (28.1%). 73.79% pressure zone concentration exposed systematic default vulnerability.
Key metrics: 80.59% recovery, 11.85% default rate, 46.08M expected loss, 17.22% DTI. Dashboard detected inverse recovery-profitability correlation requiring capital restructuring.
35%
Improvement in campaign efficiency
6
Conversion stages tracked
10+
Geographic markets analyzed


Process
Data Processing & Quality Assurance: Processed 140,000+ loan records spanning 2007-2014 using seven-step cleaning checklist in Google Colab. Ensured data quality across 50+ features including borrower demographics, loan terms, payment history, and loan status.
Metric Framework Development: Established comprehensive credit risk metrics aligned with industry standards. Core indicators: Recovery Rate, Default Rate, Loss Given Default (LGD), Probability of Default (PD), Expected Loss (EL = PD × LGD × EAD), ROI. Supporting indicators: DTI Rate, Average Income, Public Record Rate reflecting borrower quality.
Dashboard Architecture Design: Structured four-page analytical framework. Overview: Portfolio health trends with quality distribution. Credit Risk: Risk decomposition by grade with pressure zone analysis. Geographic: Regional loan volume, state-level treemaps, concentration risks. Portfolio: Distribution by purpose, grade, term, and loan size.
Technical Implementation: Built DAX measures: Recovery Rate = DIVIDE(SUM(total_pymnt), SUM(loan_amount), 0), Default Rate, LGD, EL = [PD] * [LGD] * [EAD], ROI. Created conditional formatting highlighting pressure zones, trend visualizations tracking 2007-2014 metrics, and geographic heat maps.
Insight Generation: Conducted time-series analysis revealing "False Recovery Peak" (2011-2012) and "Lagged Credit Deterioration" (2013-2014). Performed cohort analysis identifying vintage effects where 2010-2011 originations triggered 2013-2014 defaults. Validated geographic insights confirming South region mismatch and East region opportunity.

Conclusion
The Power BI credit risk dashboard transformed reactive portfolio management into proactive risk mitigation. Multi-dimensional analysis enabled early detection of 73.79% pressure zone concentration and geographic misallocation destroying $50-100M annual interest income.
Cohort effect analysis provided visibility into lagged quality decay, where 2011's apparent success (107% recovery) masked 2013-2014's structured defaults. Regional rebalancing insights—reallocating from South (75.7% recovery) toward East (81.3% recovery)—offered concrete optimization strategies.
This project demonstrated that comprehensive frameworks combining standardized metrics (PD, LGD, EL, ROI) with contextual analysis deliver sustainable risk management capabilities, enabling financial institutions to balance profitability with prudent capital provisioning during volatile credit cycles.


